To show how different developments can affect the long-term financial position of the national pension system and the size of pensions, projections are presented for the evolution of the pension system over the next 75 years in.
This section is primarily based on calculations made using the Swedish Pensions Agencys Pension model. The agencys Typical-case model has also been used. These models may be found on the agencys website. Projections of the pension system are as usual based on the system’s financial position at the latest year-end. Last year, there were concerns that the Covid-19 outbreak would have a major impact on the financial position of the pension system. However, pension contributions for 2020 were slightly higher than 2019 despite rising unemployment, and the market value of AP funds on 31 December 2020 was higher than in 2019. The higher mortality rate among the elderly is not captured by the model simulations, being based on demographic assumptions from previous years generated by Statistics Sweden.
The long-term financial position of the inkomstpension system is described below in three different projections, or scenarios. These are referred to as the base, optimistic and pessimistic scenarios.
There is also an alternative baseline scenario in which retirement ages follow the expected recommended retirement age.
The following three aspects of financial position treated are:
- Net contribution
- Fund strength
- Balance ratio
The net contribution is the difference between the system’s contribution revenue and pension disbursements. For a better comparison, the net contribution is expressed in the scenarios as a percentage of total paid-in contributions; this adjusts for the volume effect of long-term economic growth. The net contribution is currently -10.4 percent.
| 2020 | |||
|---|---|---|---|
| Primary net lending | Net contribution | Contribution | 295 |
| Pensions | -326 | ||
| Total Net contribution | -31 | ||
| Costs of administration etc., net | -2 | ||
| Total Primary net lending | -33 | ||
| Return | Interest income | 8 | |
| Dividends on shares | 17 | ||
| Total Return | 25 | ||
| Net lending | -8 | ||
- There may be some minor deviations from the National Accounts.
The net contribution corresponds (after deduction for costs of administration etc.) to the primary net lending of the system. Total net lending includes the net return of the National Pension Funds, which consists of interest income and dividends on shares.
Net lending contributes to the change in the size of the National Pension Funds. In addition, there are upward and downward fluctuations, sometimes considerable, in the market value of the securities held. In 2020, the total return generated by the buffer funds (First – Fourth and Sixth AP Funds) was SEK 133 billion.
Fund strength is the market value of National Pension Fund capital divided by pension disbursements for the year. Fund strength shows how many years of pension disbursements can be financed by the fund. For the year 2020 fund strength was 5.2 years.
The balance ratio is a measure that summarizes the financial position of the inkomstpension system. The balance ratio is the ratio between the total assets of the system and its liabilities. The assets consist of the contribution asset with the addition of the market value of the National Pension Funds. (For a more detailed discussion, see chapter 4 How the National Pension System Works and Appendix B Mathematical Description of the Balance Ratio). Calculated on the basis of assets and liabilities as of December 31, 2020, the balance ratio was 1.0824.
The future financial position of the inkomstpension system will depend on the development of several demographic and economic factors. The three scenarios studied differ in the following respects:
- Demographic development
- Change in average income
- Return on the National Pension Funds
The detailed assumptions for the scenarios are presented last in this chapter under the heading Assumptions in the Calculations for the Three Scenarios. A key factor in demographic development is the number of contributors, which is determined by the number of people of working age and the proportion of these who have earned income or other pension-qualifying and contributory income.
The development of the working-age population depends primarily on net immigration and – in the longer term – the birth rate. The development of the number paying contributions is of significance for the financial position of the system. Pensions and the pension credit earned by the gainfully employed are revalued annually by the change in average income (the income index, or the balance index in years when balancing is activated). If there is an increase in the number of people with incomes who are paying contributions, the consequences will be that the net contribution, the buffer fund and the balance ratio all increase.
The change in the average income of the economically active is of limited importance for the net lending of the pension system, for pensions are linked to the income index, which follows average income. A change in average income results in corresponding changes in both contribution inflow and pension disbursements. In principle, therefore, a change in average income will have no effect on the relative net contribution. The value of the inkomstpension will of course be heavily influenced by the change in the income index.
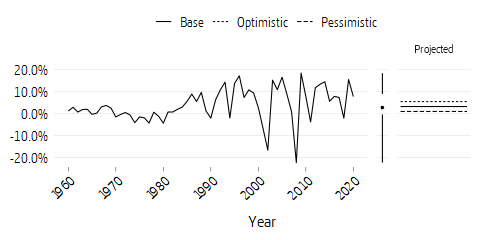
The return on the National Pension Funds affects the size of the Funds and thus fund strength and the balance ratio as well. The negative effect of weak growth in the net contribution on fund strength and the balance ratio can be offset by a high return on fund capital. In the base scenario, the real annual return assumed is 3.25 percent; in the optimistic and pessimistic scenarios, the respective returns assumed are 5.5 percent and 1.0 percent. A factor of importance for both fund strength and the balance ratio is the difference between the return and the average income. This is due to the fact that both pension disbursements and the system’s pension liability grow at the same rate as average income, whereas the market value of the National Pension Funds grows with the return and is included in the numerator both for the measure of fund strength and for the balance ratio. See Appendix B Mathematical Description of the Balance Ratio.
In summary, the net contribution will be negative in the base and pessimistic scenario for many years to come. Pension disbursements are thus forecast to exceed contribution revenue for these scenarios.
As previously noted, the net contribution is the difference between contribution revenue and pension disbursements in relation to contributions. Since the birth cohorts in the population differ in size and have worked to differing degrees, the contribution revenue and pension disbursements of the system will vary over time. For a better comparison of the net contribution in the three scenarios, the net contribution has been divided by the inflow of contributions in the scenario. This eliminates the volume effect of the differing growth rates on the net contribution in monetary terms.
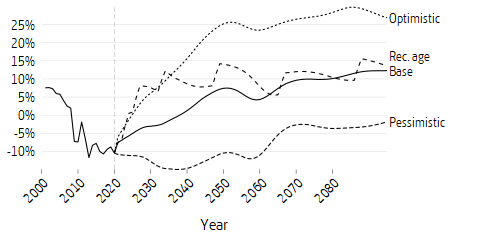
The net contribution was negative for the first time in 2009 and is expected to remain so for many years in the base and pessimistic scenarios. The explanation is that the large birth cohorts of the 1940’s almost completely have left the labour force and retired. The negative balancings of 2010, 2011 and 2014 appear in the diagram as improvements in the net contribution. Around 2020 the net contribution begins to slowly improve and the contribution deficit to slowly decrease. From 2038, income is expected to be greater than expenditure in the base scenario. The principal reason is that the large birth cohorts of the 1990s and the 2010s will be of working age at the same time as the cohorts of the 1960s with pension disbursements will be decreasing; see Figure 7.10 at the end of this chapter. If pension-related age limits are raised in accordance with the proposals in DS 2019:2 (Raised Age Limits in the Pension System and in Other Social Security Systems) and occur under the conditions in Statistics Sweden’s population projection from 2020, the net contribution will be positive as early as 2024.1 With each increase in the recommended retirement age, net contribution grows and then declines until the next increase in the recommended retirement age. The decline is due to pension disbursements being higher than in the base scenario due to retirement being postponed.
The effect of demography is also reflected in the peaks and troughs in the figure above. The difference in timing of the peaks and troughs between the pessimistic and other scenarios is due to different demographic assumptions. In the pessimistic scenario, net contribution is negative throughout the whole period, but in the optimistic scenario up until and including 2025 The pessimistic scenario has low net immigration and reduced birth rate (see Figure 7.10).
The size of the buffer fund is expressed in terms of fund strength, that is, the fund capital at year-end divided by pension disbursements for the year. Fund strength shows how many years of pension disbursements the fund can finance without additional contributions or return in the future. The different development of the buffer fund in the three scenarios is due to differences in net contribution and in the assumed return on the fund.
Fund strength has averaged 4–5 years since 1990. At the end of 2020, it was 5.2 years.
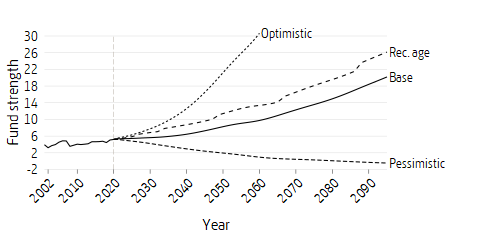
In the base scenario, fund strength increases as the contribution net is assumed to have a positive development combined with the fact that the funds’ return (3.25 percent) is expected to exceed average income growth (1.8 percent). If retirement ages are raised concurrently with the recommended retirement age, fund strength will be even higher because net contribution will be positive earlier than in the base scenario with no retirement age increases.
In the optimistic scenario, fund strength grows faster than in the base scenario, which is explained by a stronger improvement in the contribution net and a greater difference between fund return (5.5 percent) and average income growth (2.0 percent). In 2028, fund size corresponds to 7 years of pension disbursements.
In the pessimistic scenario, average income growth is equal to as the fund return (1.0 percent. Due to the unfavourable age composition, the fund will be depleted by 2083 and will continue to drop.
The financial position of the inkomstpension is expressed in terms of a ratio: the system’s assets in relation to pension liabilities (see the section A Rate of Interest Other Than the Income Index – Balancing in chapter 4 How the National Pension System Works). When the ratio is less than one, liabilities exceed assets. A ratio of 2.0 means that assets are twice as great as liabilities and that the system in principle is fully funded, that is, the buffer fund, the contribution asset and the pension liability are of equal size.
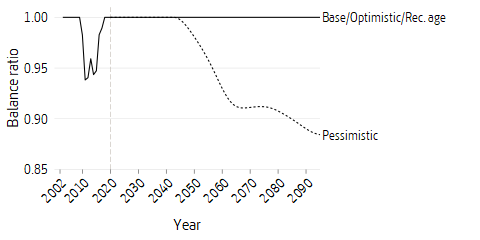
In 2010 balancing was activated, and it ended in 2018. When balancing is activated, “interest” is credited to pensions and pension balances through the change in the income index and the balance ratio. As long as balancing is activated, the cumulative indexation is less than it would have been without balancing but in the years the balance ratio is greater than 1 during a balancing period, indexing is greater than that of the income index.
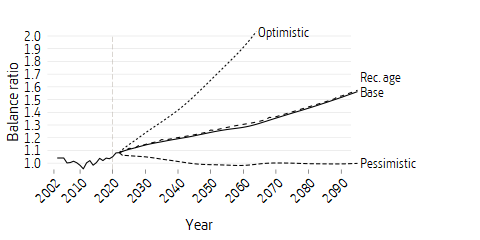
In the base scenario the balance ratio is greater than 1 throughout the projection period. In the base scenario the balance ratio strengthens gradually because of demographic factors and the fact that the return on the buffer fund is greater than the income index. The balance ratio reaches 1.1 around 2024, a level that according to the proposal in “Utdelning av Overskott i inkomstpensionssystemet” (Distribution of Surpluses in the Inkomstpension System, (SOU 2004:105) would mean that there were distributable surpluses. However, no such proposal has been presented to the Swedish Parliament.
In the recommended retirement age alternative and the baseline scenario, the curves follow each other because the assumptions are the same and the increase in pension credit implies an equal increase in pension liability.
In the optimistic scenario the balance ratio is also greater than 1 throughout the projection period. As of 2023 the balance ratio exceeds 1.1.
In the pessimistic scenario, the balance ratio lies between 0.981 and just over 1 throughout the whole projection period. A new balancing period will occur in 2044. After 2069 and for some years following, the balance ratio will be just over one but then it will drop again.
The figure for the balance ratio does not show the damped balance ratio but the balance ratio as a measure of the financial position of the pension system. The damped balance ratio is that which in combination with the income index affects the upward adjustment of pensions and pension balances during balancing periods. The effects of this are shown in the table for the Cumulative balance ratio product and in Figure 7.4. The balancing period that starts in 2044 in the pessimistic scenario continues throughout the whole projection period, despite the balance ratio being temporarily greater than one at the end of the 2060s.
In addition to projections of the development of the distribution system, the Swedish Pensions Agency has calculated the development of premium pension during the same period. The scenarios are the same: base, optimistic, pessimistic, and base alternative with recommended retirement age increases.
Somewhat simplified, the calculation is based on the premise that premium pension return is evenly distributed for different ages, and that it remains constant throughout the simulation period. Of course that is not realistic. The variation from year to year is likely to resemble the high variation that has been seen historically. Nevertheless, since the purpose of the calculation is to demonstrate long-term, average features, it ignores the expected volatility.
All three scenarios have the same historical development of premium pension fund return up to and including the starting year for the projections. The average time-weighted fund return from the start of the premium pension in 1995 up to 2020 amounts to 5.4 percent. Fund return is then assumed to be the same as in the optimistic and pessimistic scenarios’ assumption of real buffer fund return. This means 5.5 percent for the optimistic and 1.0 percent for the pessimistic scenario. In the base scenario, premium pension return is 3.90 percent. In addition, inflation is 2.0 percent. As well as return on premium pension, there is an assumption of annual interest in the so-called temporary administration, the time from when the pension premium is paid by the employer or the state until it is placed in the pension saver’s account. This covers an approximate time span of 18 months. The interest rate during temporary administration is assumed to be nominally 2.75 percent in the base scenario , 3.0 percent in the optimistic scenario and 1.0 percent in the pessimistic scenario. In addition to the return on capital, the premium pension accounts are charged an administration fee that is assumed to be 0.39 percent of premium pension capital per year.2
The premium pension system is relatively young compared to most pension systems. Earnings did not start until 1995. Only persons born in 1938 or later have been able to earn a premium pension. For those born in 1938 only 4/20 of their earnings went to the income and premium pension system and the rest went to ATP. From 1995 to 1998, the fee deduction was 2 percent instead of the current 2.5 percent, which meant that the lowest actual provision was then 0.4 percent of the pension base. However, the system is growing rapidly. People born in 1970 were 25 years of age when payments to the system began. As they approach retirement age around 2035-2040, they will have been able to earn premium pension credit throughout most of their active lives. By 2060, most pensioners will have been able to earn premium pension for the whole of their professional lives and the premium pension will then have reached its mature phase.
An illustrative measure of the mature phase of the system is net contribution, that is, the difference between system income and pension disbursements. This is divided in the same way as for contributions.
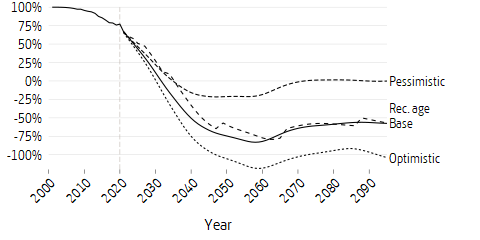
Net contribution is almost 100 percent at the outset because the volume paid out is vanishingly small. The more today’s younger cohorts start to retire, the more disbursements will negatively affect net income in the system.
When the system has been phased-in, after the year 2060, net contribution in the pessimistic scenario will begin to hover around zero. In this scenario, no return is given apart from wage growth; instead, the variations in net contribution follow demographic variations in different birth-year cohorts. In assumptions of higher return than wage growth, annual disbursements from the premium pension system will exceed annual pension contributions flowing in. Higher return will facilitate more pension disbursements, leading to a more negative net contribution. The return is an extra inflow of funds to be paid out. In the optimistic scenario there is excess return, about 3.3 percent (5.5 - 2.0 - 0.39) per year after costs. Assuming lifelong savings, each premium payment will then be worth 2-3 times more than it would be without the excess return. The high variation in return that is usually linked to high risk-taking is not apparent here. A more complete picture would also show the effect of variations in return.
Another way of looking at the maturity of the system is to study the total size of premium pension funds. During the build-up phase, the premium pension fund is relatively small. For a given birth-year cohort, the system is mature if the individuals have been able to earn premium pension credit throughout their working lives. The system is mature in its entirety when it consists entirely of such cohorts. If all cohorts were the same size, had the same income relative to the current income level, followed each other’s mortality patterns and if their excess return over and above wage growth only corresponded to the deducted administration fee, annual pension disbursements would be equal to the total annual pension premium. Fund assets would then stabilize at approximately 32-33 times the annual premium contribution. The closest we can get to this situation is in the pessimistic scenario shown in Figure 7.6 where population growth is subdued and excess return is zero. The total size of the premium penison funds then becomes 33 years’ worth of contributions, which corresponds to the expected average time each contribution remains in the fund between payment and withdrawal.The 33 years of contributions corresponds to the expected average time that each contribution is in the fund between payment and disbursement. The fund may be viewed as a 33-year-long sequence of annual payments which only grow with national wage growth. The same amount paid into the funds each year in the form of contributions flows out in the form of disbursements. Since all individuals sooner or later transition from an active working period to life as a pensioner, approximately the same amount is transferred each year from the savings phase to the payment phase as payments in and out.
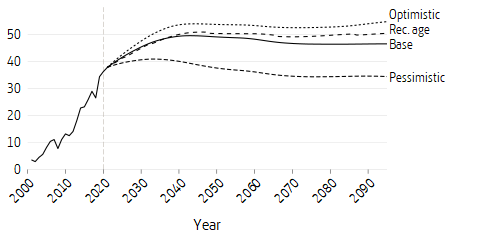
Both the baseline and the optimistic scenarios lead to a significantly larger premium pension fund due to the higher excess return assumptions. The premium pension fund is growing faster than contribution income. This will result in higher pension disbursements, as indicated in Figure 7.5.
Figure 7.6 can be said to show the fund strength, the size of funds relative to the size of contributions. At an early stage in the history of the premium pension system, without disbursements and excess returns, the fund strength corresponds in principle to the number of contribution years.
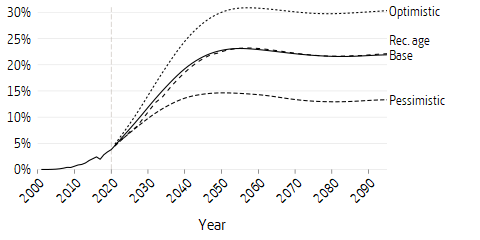
Another way to present the future role of the premium pension is to show it as a proportion of the total national pension. Earning for premium pension began, as noted, in 1995. This means that cohorts who retire today receive only a small part of their pension from premium pension. The phasing-in will continue until 2040–2050, meaning that an ever increasing share of the pension will be paid from premium pension funds. Of today’s contributions 13.5 percent (2.5 / 18.5) go to premium pension. Without excess returns, this results in pension disbursements being paid in the same proportion. Assuming an excess return, the picture changes. In the base scenario, premium pension accounts for approximately 22 percent of the income-based national pension. In the optimistic scenario, the same proportion is just over 30 percent.
Below is an account of how the pension develops relative to earned income for typical cases born in the years 1954–2020 using the three different scenarios. The effect of the scenarios on pension level has been streamlined inasmuch as pensions have been calculated for an individual who starts working at the age of 23 and retires at the so-called recommended retirement age - the age when national social insurances (unemployment insurance, sickness benefit etc.) cease and basic protection for the elderly comes into play. Income for typical cases increases with national income growth. Pension level is the national pension at the recommended retirement age in relation to average salary during the final five years of pension earning. Note that the recommended retirement age today is 65 years and is expected to be raised to 66 years in 2023. It is affecting the 1958 birth cohort which will thus not be entitled to basic protection at age 65. In 2026, the recommended retirement age is expected to be raised again by one year to age 67, affecting those born in 1960. Thereafter, the recommended retirement age will be increased by about two-thirds of the increase in life expectancy. However, this will happen with some time lag, and gradually.
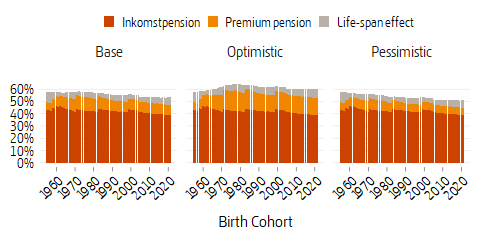
The scenarios’ pension levels at the recommended retirement age are shown in the figure above, one for each scenario. The figure also demonstrates the life expectancy effect. This constitutes total income-based national pension received when typical cases postpone their retirement sufficiently to fully compensate for the negative effect of increased life expectancy on the monthly pension. Increased life expectancy refers to the period since 1994 when the inkomstpension and premium pension system was introduced. Prolonged working life results in a higher pension due to the earning of new pension credit, return on pension capital, a lower annuity divisor in the calculation of the pension, as well as inheritance gains.3 In the figure above, the pension level typical cases reach at the higher retirement age required to compensate for the life expectancy effect, has been marked in light gray.
In the baseline scenario, the pension level decreases gradually after each increase in the recommended retirement age, and increases again as the recommended retirement age approaches. The increase is due to the fact that the latter cohort typically works an additional year. The long-term the trend is declining pension levels. One reason is the return: older cohorts with a longer pension history generally have a higher return than the assumed future return. Another reason for lower pension levels is the fact that reduced risk of death applies to all ages, from 18 to recommended retirement age, thus giving lower inheritance gains, while the change in recommended retirement age only takes into account increased life expectancy after the age of 65. People born in 1954 need to work until age 67 and 6 months to compensate for the diminishing effect of life expectancy on the monthly amount of their pension. At that retirement age, the pension is estimated to be around 57 percent of final salary income. The declining pension level despite neutralization is due as noted to the lower average return for younger people. If working life is prolonged so that the effect of increasing life expectancy on pension level is neutralized, the pension level stabilizes at around 56 percent in the base scenario.4
In the optimistic and pessimistic scenarios, growth in average income is higher respectively lower than in the base scenario, as also return on premium pension.
Balancing was discontinued in 2018 and is no longer activated. The inkomstpension is compounded (indexed) with the change in the average income in society. In this case, the ratio of the inkomstpension to final salary is not affected by real wage growth. The inkomstpension as a percentage of final salary remains unchanged. On the other hand, inkomstpension will of course be lower/higher in SEK terms in the event of lower/higher growth.
The relationship between the return of the premium pension system and the increase in average income affects the relative size of the premium pension. The larger the positive discrepancy between return and wage growth, the greater the share constituted by the premium pension. Pension level increases for typical cases if they have an occupational pension. The size of the occupational pension depends on the occupational area, but is around 20–25 percent of the pension at recommended retirement age, which raises the pension level from just over 50 percent to approx. 70 percent.
Table 7.2 below shows, among other things the life expectancy for persons at age 65 for birth cohorts 1930–2020. Remaining life expectancy at the age of 65 is expected to increase from 17 years and 5 months for persons born in 1930 to 25 years and 10 months for persons born in 2020, an increase of 8 years and 5 months. If those born in 2020 are to have the same pension level that they would have had if life expectancy had not increased, a portion of the increased life span after age 65 must be devoted to working longer. For the cohort born in 2020, working life must be extended to 72 years and 1 month. This measure is called the alternative retirement age. During 2017, the Swedish Pensions Agency changed its formula for alternative pension age.5 However, in the Swedish government proposal DS2019:2, “Hojda aldersgranser i pensionssystemet och andra trygghetssystem” (Raised age limits in the pension system and in other social security systems), another formula is proposed (normal pension age) giving a lower retirement age than the alternative retirement age and thereby a lower level of compensation since it does not take into account changes in life expectancy before the age of 65. At the same time, those born in 2020 – despite such a higher retirement age – may look forward to being pensioners 3 years and 0 months longer than those born in 1930.
| Birth cohort born in | … reaches 65 in |
Life exp- ectancy at 65 |
Expected rec. age | Time spent retired | … compared to birth cohort 1930 | Alternative Retirement Ages |
|---|---|---|---|---|---|---|
| 1930 | 1995 | 82 yr 5 m | 65 yr | 17 yr 5 m | 0 yr 0 m | 65 yr 0 m |
| 1935 | 2000 | 83 yr 1 m | 65 yr | 18 yr 1 m | 0 yr 8 m | 65 yr 7 m |
| 1940 | 2005 | 83 yr 6 m | 65 yr | 18 yr 6 m | 1 yr 2 m | 66 yr 1 m |
| 1945 | 2010 | 84 yr 3 m | 65 yr | 19 yr 3 m | 1 yr 10 m | 66 yr 8 m |
| 1950 | 2015 | 84 yr 10 m | 65 yr | 19 yr 10 m | 2 yr 5 m | 67 yr 2 m |
| 1955 | 2020 | 85 yr 4 m | 65 yr | 20 yr 4 m | 2 yr 11 m | 67 yr 8 m |
| 1960 | 2025 | 85 yr 10 m | 67 yr | 19 yr 2 m | 1 yr 9 m | 68 yr 0 m |
| 1965 | 2030 | 86 yr 5 m | 67 yr | 19 yr 9 m | 2 yr 4 m | 68 yr 5 m |
| 1970 | 2035 | 86 yr 11 m | 68 yr | 19 yr 4 m | 1 yr 11 m | 68 yr 10 m |
| 1975 | 2040 | 87 yr 4 m | 68 yr | 19 yr 9 m | 2 yr 4 m | 69 yr 3 m |
| 1980 | 2045 | 87 yr 10 m | 68 yr | 20 yr 2 m | 2 yr 9 m | 69 yr 7 m |
| 1985 | 2050 | 88 yr 3 m | 69 yr | 19 yr 9 m | 2 yr 4 m | 70 yr 0 m |
| 1990 | 2055 | 88 yr 8 m | 69 yr | 20 yr 1 m | 2 yr 8 m | 70 yr 4 m |
| 1995 | 2060 | 89 yr 0 m | 69 yr | 20 yr 6 m | 3 yr 1 m | 70 yr 7 m |
| 2000 | 2065 | 89 yr 5 m | 70 yr | 19 yr 11 m | 2 yr 7 m | 70 yr 11 m |
| 2005 | 2070 | 89 yr 10 m | 70 yr | 20 yr 4 m | 2 yr 11 m | 71 yr 3 m |
| 2010 | 2075 | 90 yr 2 m | 70 yr | 20 yr 8 m | 3 yr 3 m | 71 yr 6 m |
| 2015 | 2080 | 90 yr 6 m | 70 yr | 21 yr 0 m | 3 yr 7 m | 71 yr 10 m |
| 2020 | 2085 | 90 yr 10 m | 71 yr | 20 yr 4 m | 3 yr 0 m | 72 yr 1 m |
- Time spent retired refers to expected remaining life span at expected recommended retirement age.
In table 7.3 and in figure 7.9, the various assumptions in the scenarios are summarized.
| Base | Pessimistic | Optimistic | ||
|---|---|---|---|---|
| Inflation | 2.00 | 2.00 | 2.00 | |
| Change in average income | 1.80 | 1.00 | 2.00 | |
| Real return, net, after fees to fund management companies | Premium pension funds | 3.90 | 1.00 | 5.50 |
| Buffer fund | 3.25 | 1.00 | 5.50 | |
| National Debt Office | 2.75 | 1.00 | 3.00 | |
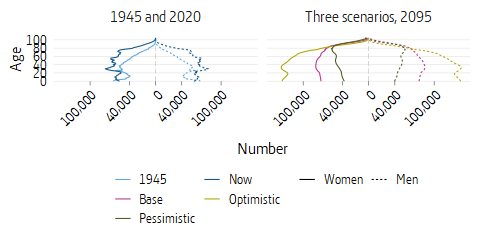
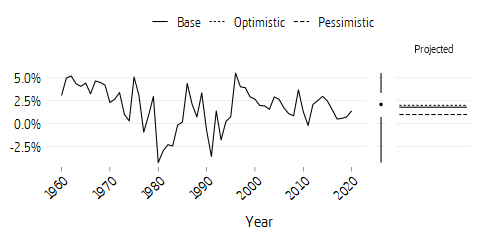
The demographic development in the base scenario follows the latest official population forecast of Statistics Sweden from 2020. There it is assumed that nativity will eventually stabilize at 1.86 children per Swedish-born woman. The average life span for men born in 2020 is 81.5 years and is expected to increase to 85.4 years in 2050. For women the average life span is expected to increase from 84.8 to 87.8 years during the same period. For the remainder of the time until the end of the projection period in 2094, the average life span will increase by approximately 4 years for both men and women. The 2020 population projection has a total net immigration of 250,000 people in the next 5 years. Subsequently net immigration drops by a few thousand persons per year to stabilize at just over 20,000 people per year. This year’s assumption for the base scenario is constant employment, that is to say, future employment is the same as today. The reason for this is that Statistics Sweden’s main alternative implies future employment increases in the older section of the population. This can now be controlled instead in the Pension Agency’s pension model with pension age increases. Real average income is expected to increase by 1.8 percent per year. The buffer fund’s real return is assumed to 3.25 percent per year. As of 2020, the minimum retirement age is 62 years.
For the base scenario with recommended retirement age increases, everything is the same except the chance to retire is postponed by a whole year. This means that the cohort affected by the higher recommended retirement age works for another year and those with transfers also receive these for another year. Since the mortality rate is the same, the time as a pensioner is reduced by one year.
The demographic assumptions do not follow the base scenario and are based on Statistics Sweden’s forecasts from 2018. Both nativity and net immigration are higher than in the base alternative. In the long run, nativity is estimated at 2.06 children per Swedish-born woman. Long-term immigration is assumed on average to show a surplus of some 70,000 persons per year. Mortality is assumed to be constant and to retain the same 2019 values throughout the whole of the forecast period. Assumptions regarding employment are the same as in the base scenario. The real growth in average income is 2.0 percent after 2020, and the real rate of return on the buffer fund is assumed to be 5.5 percent per year in the future. The real return for the premium pension is also assumed to be 5.5 percent before costs of administration. The temporary administration of the premium pension at the Swedish National Debt Office is assumed to yield an interest rate of 3.0 per cent. As of 2020, the minimum retirement age is 62 years.
The assumptions in the pessimistic scenario about birth rates and net immigration are lower than in the base alternative. Nativity is assumed to be about 1.65 children per Swedish-born woman. Net immigration is negative during the period 2022–2056, later rising to approximately 5,000 per year. In the pessimistic scenario life expectancy increases faster than in the base scenario. Remaining life expectancy increases from 84.5 years for women to 89.4 years in 2050 and 95.0 years in 2095. The corresponding figure for men is an increase from 81.3 to 87.3 and finally 93.5 years. The proportion employed is assumed to remain unchanged for the time ahead. The real growth in average income is assumed to be 1 percent per year. The real rate of return for the Buffer Fund, the National Debt Office and the premium pension funds is also assumed to be 1 percent per year. With a return equal to the growth in average income, the return of the buffer fund does not, in principle, contribute to the long-run financing of pensions. The buffer fund is then demographically determined and serves as a neutral repository of pension capital for the purposes of the system’s financing. The assumptions in the pessimistic scenario mean that the contribution flow grows slowly in relation to the desired indexation of the average income. The pessimistic scenario describes how pensions are affected by a prolonged weak development with an unfavorable age structure. As of 2020, the minimum retirement age is 62 years.
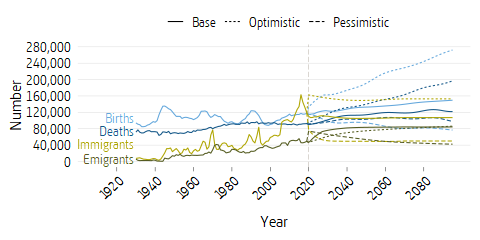
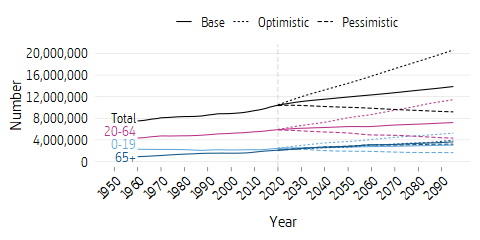
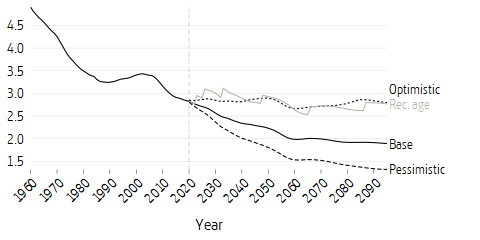
Figure 7.12 shows the support ratio for the elderly for the three scenarios and for the base scenario with recommended retirement age increases. With each increase in the recommended retirement age, one cohort is moved from belonging to the elderly to belonging to the gainfully employed, leading to a temporary increase in the support ratio for the elderly. For the base and the pessimistic scenarios with a fixed age limit of 65, there is a steadily declining support ratio for the elderly. The pessimistic scenario stands out with almost 1.35 persons of working age per old person at the end of the simulation period. This is due to unfavourable demographics with increasing life spans, low net immigration combined with low fertility.
- The pension model uses a naive assumption that when the recommended retirement age is raised, the insured postpone their retirement by a full year. The gainfully employed thus work a full extra year and receive one year less of pension disbursements. This is unlikely to happen in real life. ↩
- The costs, 0.39 percent, are higher from this year forward since they previously consisted only of the Pension Agency’s contributions. Furthermore, from this year the average fund charge is also included, which was 0.21 percent in 2020. ↩
- Inheritance gain can be seen as compensation for the risk of the typical case not surviving until retirement and thus not receiving part of the pension due. ↩
- Note that the outcome also depends on the phasing-in of the system (1995 was the first year it was possible to earn pension credit in the premium pension system, and at the end of 2001 the fund marketplace was opened for individual fund choice). ↩
- Report from 2017: Formula for an alternative retirement age ↩