Sweden’s national pension is based primarily on earnings. In each of their economically active years, gainfully employed individuals contribute a certain portion of their income toward a pension. The bulk of their contribution goes to the inkomstpension system, a lesser share to the premium pension system. Pension credit is accumulated over a long period, 40–45 years, sometimes even more. The size of future pensions will thus depend on the change in the value of contributions paid into the system. For example, someone who deposits a constant amount each year for 40 years, at an annual interest rate of 2 percent, will end up with a final balance that is 54 percent higher than that of a saver with no return.
In the inkomstpension system the change in value is normally determined by the percentage increase in the income index. This index follows the average growth rate in the earnings of the economically active. In the premium pension system, on the other hand, the change in value is determined by the return on the funds of pension savers. For pensioners who have opted for traditional insurance, the increase in value is determined by the rate of return decided by the Pensions Agency, based on the increase in value of the assets invested in by the Pensions Agency.
The discussion below applies hereafter to the development within fund insurance. A significant difference between the inkomstpension and premium pension system is that the change in the value of the inkomstpension is the same for everyone, whereas the return of the premium pension may vary from one individual to another, depending on the type of funds chosen.
The pension balance in the inkomstpension system is normally written up in step with the income index, but during a balancing period, the balance index is used. Between 2010 and 2018, there was a period of rebalancing.
The change in value only occurs at the turn of the year for the income/balance index, unlike the premium pension system, where changes are ongoing. Indexation between 2020 and 2021 was 2.2 percent (see the year 2020 in table 6.1 below). It was thus by this percentage that earned inkomstpension credit of employed persons was changed at the end of the year.
For pensioners the inkomstpension and the ATP are recalculated each year by the change in the income-/balance index, reduced by 1.6 percent. The reduction is due to the fact that an advance interest rate of 1.6 percent has already been credited to the inkomstpension in the annuity divisor.1.
During a balancing period, inkomstpension is affected by the development of capital markets because the value of the AP funds is included in the calculation of the balance ratio. AP funds value represents almost 16 percent of reported assets and the impact is therefore not extensive. The decrease in the market value of investments in the record drop of 2008 was one of the main reasons why balancing was activated in 2010. The positive return has subsequently contributed to higher indexation of inkomstpension and to the ending of balancing in 2018.
Change in value of the premium pension system is wholly determined by developments in capital markets. After a positive development on the global (calculated in SEK) as well as Swedish stock markets in 2019, the rise continued during the beginning of 2020. This was followed by a dramatic decline in the spring as a result of the coronavirus pandemic. However, capital markets recovered and the 2020 change in value of premium pension funds was finally 6.4 percent.
| Income-/balance index | Premium pension indexa | |
|---|---|---|
| 2004 | 2.4 | 8.8 |
| 2005 | 2.7 | 30.6 |
| 2006 | 3.2 | 12.1 |
| 2007 | 4.5 | 5.7 |
| 2008 | 6.2 | -34.2 |
| 2009 | -1.4 | 34.7 |
| 2010 | -2.7 | 12.2 |
| 2011 | 5.2 | -10.7 |
| 2012 | 5.8 | 12.1 |
| 2013 | -1.1 | 21.1 |
| 2014 | 2.5 | 20.7 |
| 2015 | 5.9 | 6.4 |
| 2016 | 4.4 | 10.9 |
| 2017 | 2.6 | 12.6 |
| 2018 | 3.1 | -3.4 |
| 2019 | 3.8 | 29.5 |
| 2020 | 2.2 | 6.4 |
- The premium pension index measures how much an amount paid into the system at a certain point in time has changed over a certain period (so-called time-weighted return). In this case the period is the same as a calendar year. The return for individual pension savers will normally have varied depending on the funds that they have chosen.
The change of value in the premium pension system can be measured in several ways. The measures presented in this chapter are so-called time-weighted return and capital-weighted return. Another term for capital-weighted return is internal rate of return.
Time-weighted return is used to describe the change in value of a fund or an index. The time-weighted return shows the return on one krona deposited at the outset of the period. No consideration is given to whether deposits or withdrawals have been made during the period.
Capital-weighted return can be used for evaluating the premium pension on an overall basis, but also individual accounts. Consideration is given to the timing and amount of all deposits and withdrawals for the account, and to the balance at the end of the period. The capital-weighted return matches the average annual interest rate during the period.
In the section Income and Premium Pensions as Complementary, time-weighted return is used, whereas capital-weighted return is used in the section Change in Value of Pension Savers’ Accounts. (For a more thorough description of the time- and capital-weighted return, see Appendix A.)
One reason for establishing the premium pension as complement to the inkomstpension was that variations over the years in the growth of earnings and return on capital could tend to offset each other. Development over time shows that these indexations do not necessarily follow each other (see table 6.1 above). The importance of spreading risk may increase in the future, when the premium pension funds’ share of total pension capital increases.
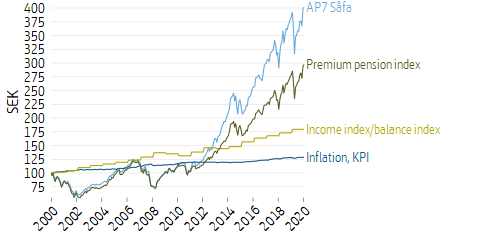
In December, 2000, premium pension savers could begin investing their capital in the funds of the system. Before then, the capital had been under temporary management, which had invested it in an interest-bearing account with the Swedish National Debt Office (Riksgälden). The value of an amount deposited at the start in 2000 has varied substantially over the years. Indexation of the inkomstpension have however remained relatively stable.
Those who refrained from selecting funds, and thus had their moneys invested in the AP7 Såfa, the Central Government Fund Management Alternative (Statens Årskullsförvaltningsalternativ), had by December 31, 2020 obtained a return on moneys invested in December, 2000, greater by 104 percentage points than that of the average fund saver (premium pension index, which includes AP7 Såfa).
The time-weighted return shown above does not take into account changes in the amount of capital during the period of saving, most notably deposits, but disbursements as well. For individual savers, but also for the premium pension system as a whole, it is important to show the return as measured by the capital-weighted rate of return. One reason why this is the case is that the aggregate deposits on pension savers’ accounts have grown significantly over time, as the system is under construction. For example, the funds included almost twice as much capital in December 2019 as in December 2014. In the subsequent years, i.e., 2020 and 2015 respectively, the time-weighted returns were the same (see table 6.1), but the amount that could benefit from this positive return was thus much larger in 2020. The capital-weighted rate of return takes this difference into account by assigning greater weight to 2020 than to 2015.
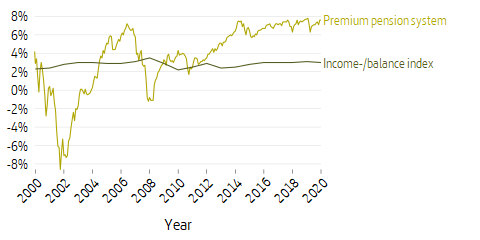
Figure 6.2 shows the progression by year of the average annual capital-weighted rate of return for the premium pension built up at different points in time, as well as the corresponding rate of return if the premium pension had instead developed like the income/balance index. With this return, the capital-weighted rate of return through the end of 2020 would have been 3.0 percent per year. This may be compared with the actual average capital-weighted rate of return for the premium pension, 7.6 percent through 2020. The diagram shows that the corresponding calculation through 2008 was minus 0.8 percent for the premium pension system and plus 3.5 percent if the premium pension system had developed like the income/balance index. Note that the curve does not show the actual capital-weighted rate of return for inkomstpension savers, since the capital structure of the inkomstpension system is considerably different.
Figures 6.1 and 6.2 reflect two points of view for the saver, based on time-weighted and capital-weighted return as explained above. In the first diagram SEK 100 is deposited in the premium pension system in December, 2000, and it is worth about SEK 297 at the end of December, 2020. The value reached its low point of SEK 55 during 2002–2003. To take into account the deposits of premium pension savers into the system each year, and the long-term nature of pension saving, the second diagram shows the average annual capital-weighted return up until a certain point in time. The average annual capital-weighted return on moneys paid into the premium pension system was 7.6 percent in December, 2020. The annual average capital-weighted return was lowest, at -8.6 percent, in 2002 and highest, at 7.7 percent, in 2019. As the premium pension system matures, the annual variation in capital-weighted return will diminish, as is clearly shown in the diagram.
Figure 6.3 shows the average capital-weighted rate of return for pension savers sorted according to their first year of contributing to the system. The difference in return decreases the longer the birth cohorts have participated and been paying into the system. Pension credit earned in 2019 was invested in funds in December 2020; this also applies to new savers who had made no active fund choice. Prior to the earning year 2017, capital for new savers was invested in April of the following year.
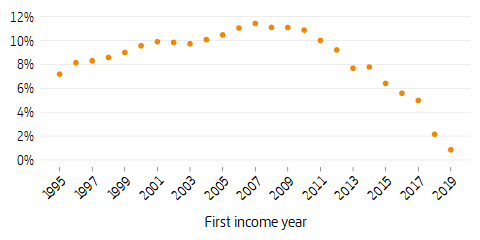
Figure 6.4 shows the distribution of the capital-weighted rate of return among pension savers who have been in the system for an equally long time. Among pension savers who began earning pension credit in 1995 and who then invested it in funds in 2000, just over 99 percent reported a positive change in value at the end of 2020. The figure is divided into those who at some time made an active choice (the Fund Market) and those who never made an active fund choice (AP7). The fact that return differs among those who only had the national pre-selected alternative is mainly because the distribution between the two funds involved, AP7 Equity Fund and AP7 Fixed Income Fund, varies according to the age of fund savers.
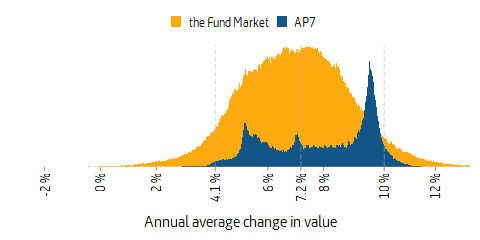
Since the data refer to participants since 1995, the explanation for the spread is not that they entered the system at different times. Compare Figure 6.3, which shows the distribution by first year of credit earning. Rather, the principal reason is the choice of fund investments with differences in rate of return.
Table 6.2 below summarizes the average annual change in value with the time- and capital-weighted rates of return during the existence of the premium pension system. From 1995 on, allocations were set aside for the premium pension, but not until December, 2000, were the moneys paid into funds. During the period 1995–2000 the moneys were invested in interest-bearing assets.
| 1995–2020 | 2000–2020 | |
|---|---|---|
| Premium pension index (time-weighted) | 5.4 | 5.6 |
| Premium pension (capital-weighted) | 7.6 | 7.8 |
| Income/balance index (time-weighted) | 2.8 | 3.0 |
| Income/balance index (capital-weighted) | 3.0 | 3.1 |
| Inflation | 1.1 | 1.3 |
The aspects of the pension system that relate to its change in value cannot be judged on the basis of the changes in value over only a few years. The importance of a long-term view is easily underestimated, both when stock prices are rising and when they are falling. For the 90-year period 1924–2014, the average real rate of return globally was 6.1 percent per year. However, this does not guarantee such a return in 10 or even in 20 to 30 years. For different 10-year periods since 1930, the real rate of return has varied considerably, on the Stockholm Stock Exchange, from 23 percent per year (1980–89) down to negative figures in certain other periods. There have often been major changes between adjacent 10-year averages, both on the Stockholm Stock Exchange and world-wide.
One conclusion is that “long term” is not 5–7 years, or even 10 years, as is sometimes said, but that in the matter of equity returns one should imagine a much longer period. In the context of pensions, it is reasonable for younger people to have a 30–40-year perspective. Historically, the real value development for longer periods has also been much more stable. Only over a term of at least 35 years is the real value growth for global equities comparable in stability with Swedish real wage development over 10 years. Real wage growth is the factor above all that governs the value growth of inkomstpension. The real wage per employee increased over the period 1918–2012 by an estimated 2.1 percent per year, thus significantly slower than the annual 6.1 percent of real stock returns. The difference was most pronounced during the 1980s and 1990s.
- For a more detailed description of the income index and the balance index, see chapter 4 How the National Pension System Works. ↩