Note 1 refers to both inkomstpension and premium pension. Notes 2–14 refer to inkomstpension and notes 15–25 refer to premium pension. All amounts are stated in SEK million. In some tables, the sum of the secondary level items does not tally with the total due to rounding.
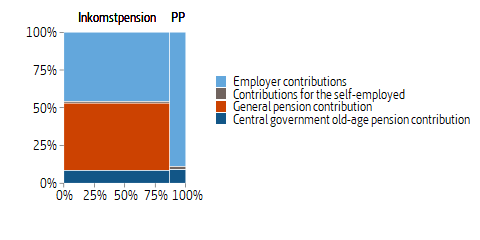
In the national pension system there are a number of different contributions, as can be seen in table 8.1. Not all contribution revenue goes to the pension system. The part of old-age pension contribution transferred to the central government budget is that part of income above the ceiling on pension-qualifying income. Before deduction for general pension contribution this ceiling is 8.07 income-related base amounts, and after such deduction it is 7.5 income-related base amounts. Since these contributions do not correspond to any pension credit, they are in fact taxes. The old-age pension contribution is paid by employers and self-employed persons; the general pension contribution is paid by all gainfully employed persons who thus earn pension credit. In addition, national old-age pension contributions are paid from various appropriations in the central government budget for pension credit resulting from certain transfer payments such as sickness benefit and unemployment cash benefit. The central government also pays a pension contribution for so-called pension-qualifying amounts, for years with small children and for study, for example.
Table 8.1 on the next page shows pension contributions received during the income year by the Swedish Social Insurance Agency and the Swedish Pensions Agency. Employer contributions or self-employment contributions are entered in the Social Insurance Agency account. The contributions for the inkomstpension system are transferred to the Swedish Pensions Agency and thereafter to the National Pension Funds. Those contributions calculated to correspond to pension credit for premium pension are forwarded to the National Debt Office. The general pension contribution and the general government old-age pension contribution are entered in the Swedish Pensions Agency account before being transferred to the National Pension Funds and the premium pension system respectively. Of the contributions registered in a particular year, a portion relate to the preceding year or, in some cases, to several years earlier. Employer contributions, for example, are registered at least one month after the corresponding salaries are paid.
The general pension contribution is transferred in its entirety to the National Pension Funds. For employer contributions and self-employment contributions, there is a preliminary allocation among the National Pension Funds, the premium pension system and the central government budget. The allocation for a year is made according to set percentages calculated by the Swedish Pensions Agency and set by the Government. It is intended that the premium pension system should receive in the course of a year contributions equivalent to premium pension credit earned during that year while the state receives contributions corresponding to taxable earnings over the so-called ceiling of 8.07 of the income-related base amount. Remaining contributions are to go to the National Pension Funds. National old-age pension contributions for a year are similarly distributed between the National Pension Funds and the premium pension system according to fixed percentages.
|
Inkomst- pension |
Premium pension |
Central government budget | Total 2020 | Total 2019 | ||
|---|---|---|---|---|---|---|
| Employer contributions | 135,573 | 40,096 | 20,146 | 195,815 | 193,865 | |
| Contributions for the self-employed | 3,168 | 936 | 473 | 4,577 | 4,433 | |
| General pension contribution | 132,033 | 0 | 0 | 132,033 | 129,503 | |
|
Central government old-age pension contribution |
24,999 | 4,103 | 0 | 29,102 | 25,440 | |
| Final settlements etc. |
Final settlements in 2020 for 2018 |
-20 | -44 | 64 | 0 | 0 |
| Collection loss, settlement | -224 | 0 | 0 | -224 | -227 | |
|
Adjustment to accounting of National Pension Funds and premium pension system |
-30 | 636 | 0 | 606 | 625 | |
| Total Final settlements etc. | -274 | 592 | 64 | 382 | 398 | |
| Total | 295,499 | 45,727 | 20,683 | 361,909 | 353,639 | |
- Contributions received by the Swedish Social Insurance Agency/the Swedish Pensions Agency in 2020 and transferred to the National Pension Funds, the premium pension system and the central government budget, respectively.
To ensure that the premium pension system has received contributions corresponding to the pension credit earned for a particular year and that the central government budget has received contributions for the part of incomes above the contribution ceiling, any discrepancies are reconciled two years later. Adjustments are then made between the national budget, premium pension and the inkomstpension system (the National Pension Funds). The settlements mean that contribution revenue is redistributed between the premium pension system, the central government budget and the National Pension Funds, ensuring that the first two receive the correct amount for a year’s contributions while the National Pension Funds receive the remainder. Settlements are also made between the national pension system and the various appropriations in the government budget charged with national old-age pension contributions. This is to ensure that the various appropriations pay the correct amount for national old-age pension contributions. These settlements are made three years after the year they apply to.
Contribution revenue to the inkomstpension system increased between 2019 and 2020 by SEK 6.1 billion (2.1 percent), which is a relatively low increase but greater than the change in the sum of wages and salaries (0.8 percent).
The difference between the National Pension Funds’ reporting of contribution revenue and that of the Swedish Social Insurance Agency and the Swedish Pensions Agency (SEK -30 million) can be explained largely by periodization differences. The difference between reported contribution revenue in the premium pension system and that reported by the Swedish Social Insurance Agency/the Swedish Pensions Agency (SEK 636 million) is partly due to certain adjustment amounts being included in the amount for the premium pension system (see Note 18).
| Employer, self-employed, and centr. govt. pension contribution | General pension contribution | Total | |
|---|---|---|---|
| Earned incomeb | 200,392 | 123,045 | 323,437 |
| Transfer payments, see Table B | 13,131 | 8,988 | 22,119 |
| Pension-qualifying amounts, see Table C | 15,971 | 0 | 15,971 |
| Total | 229,494 | 132,033 | 361,527 |
- The allocation of the general pension contribution between the two types of contribution base is estimated and is not shown in the accounting systems.
- Including sick pay and self-employment income, excluding transfer payments.
The general pension contribution is 7 percent on earned income and pension-qualifying transfers such as sickness benefit, etc., but not sickness and activity compensation. The general pension contribution is only charged on income up to the tax ceiling of 8.07 income base amounts and for incomes above 0.423 price-related base amounts. At the time of tax assessment, a tax deduction is made corresponding to the general pension contribution. In practice, this means that the state finances the contribution.
The pension contribution paid by employers and self-employed on earned income, and by the central government on the above-mentioned transfer payments, is 10.21 percent. The central-government pension contribution on sickness and activity compensation and on so-called pension-qualifying amounts, which are not subject to the general pension contribution, is 18.5 percent.
The allocation in Table 8.2 A refers to the contributions received by the Swedish Social Insurance Agency or the Swedish Pensions Agency in 2020.
| Cent. govt. pension contrib. | General pension contrib. | Total | |
|---|---|---|---|
| Sickness cash benefit | 4,049 | 2,772 | 6,821 |
| Rehabilitation cash benefit | 0 | 0 | 0 |
| Allowance for care of close relatives | 16 | 11 | 27 |
| Work injury compensation, etc. | 195 | 133 | 328 |
| Parental insurance | 4,423 | 3,027 | 7,450 |
| Care allowance | 399 | 273 | 672 |
| Unemployment cash benefit etc. | 3,991 | 2,732 | 6,723 |
| Educational allowance | 0 | 0 | 0 |
| Artists’ Board | 7 | 5 | 12 |
| Allowance to disease carriers | 51 | 35 | 86 |
| Total | 13,131 | 8,988 | 22,119 |
- The allocation of the general pension contribution among the different types of transfer payments is estimated and is not shown in the accounting systems.
| Sickness and activity compensationa | 5,196 |
|---|---|
|
Amounts credited for years with small children |
7,565 |
| Amounts credited for studyb | 3,105 |
| National service | 105 |
| Total | 15,971 |
- Amount refers to contributions for disbursements of both pension-qualifying benefits and pension-qualifying amounts. In both cases the contribution is 18.5 percent.
- A minor portion of amounts credited for study consists of pension-qualifying income.
| 2019 | 2020 | ||
|---|---|---|---|
| Pension disbursements | ATP disbursements | 162,584 | 157,153 |
| Inkomstpension disbursements | 152,140 | 169,104 | |
| Total Pension disbursements | 314,724 | 326,257 | |
| Transfers to European Communities | 0 | 9 | |
| Total | 314,724 | 326,266 | |
During the year, SEK 326,257 million was paid out in pensions from the National Pension Funds, an increase of SEK 11.5 billion (3.4 percent). In 2019, disbursements increased by SEK 10.3 billion or 2.9 percent. Pension disbursements of just over SEK 326 million reduced pension liability to pensioners by a corresponding amount. According to the Act (2002:125) on Transfer of Pension Credit to and from the European Communities (EC), the value of pension credit for EC officials can be transferred from the National Pension Funds and the premium pension system to the service pension system of the EC. In 2020, more than SEK 9 million was transferred from the National Pension Funds.
| First | Second | Third | Fourth | Sixth | * | Total 2020 | Total 2019 | ||
|---|---|---|---|---|---|---|---|---|---|
| Stocks and shares | Dividends received | 2,932 | 4,214 | 4,375 | 5,002 | 10 | 0 | 16,533 | 23,649 |
|
Gain/-loss, listed and unlisted stocks and shares, net |
33,537 | 20,457 | 32,652 | 41,186 | 7,570 | 0 | 135,402 | 168,143 | |
|
Total Stocks and shares |
36,469 | 24,671 | 37,027 | 46,188 | 7,580 | -1 | 151,934 | 191,792 | |
| Bonds and other interest-bearing securities | Net interest | 1,568 | 2,956 | 2,149 | 1,489 | 17 | 0 | 8,179 | 10,937 |
|
Gain/-loss, inte- rest bearing assets, net |
2,968 | 3,757 | 3,370 | 2,829 | 0 | 0 | 12,924 | 16,710 | |
|
Total Bonds and other interest- bearing securities |
4,536 | 6,713 | 5,519 | 4,318 | 17 | -1 | 21,102 | 27,647 | |
| Other investments |
Gain/-loss, derivatives, net |
2,701 | -2,063 | -122 | 280 | 0 | 0 | 796 | -1,661 |
|
Net foreign- exchange gain/-loss |
-8,624 | -16,033 | -4,897 | -11,079 | 141 | 0 | -40,492 | 23,266 | |
| Costs of commissions | -76 | -277 | -126 | -138 | 0 | 0 | -617 | -739 | |
|
Total Other investments |
-5,999 | -18,373 | -5,145 | -10,937 | 141 | -1 | -40,314 | 21,618 | |
| Total | 35,006 | 13,011 | 37,401 | 39,569 | 7,738 | -3 | 132,722 | 240,318 | |
- Adjustment column (*) is included to adjust for various rounding effects.
The item Commission Expenses comprises fees which are not result-based. Result-based charges, brokerage fees and other expenses have reduced the return (see chapter 5 Costs of Administration and Capital Management).
| 2019 | 2020 | ||
|---|---|---|---|
| Costs of Insurance administration | Swedish Pensions Agency | 335 | 397 |
| Tax administration and other agenciesa | 406 | 441 | |
| Total Costs of Insurance administration | 741 | 838 | |
| Costs of fund administration | First National Pension Fund | 238 | 226 |
| Second National Pension Fund | 240 | 235 | |
| Third National Pension Fund | 212 | 222 | |
| Fourth National Pension Fund | 231 | 246 | |
| Sixth National Pension Fund | 95 | 89 | |
| Total Costs of fund administration | 1,016 | 1,018 | |
| Total | 1,757 | 1,856 | |
- Includes Enforcement Authority and the National Government Service Centre
For the funds, only internal administrative costs are reported. External costs of administration and custodial fees are referred to as costs of commissions and are reported as negative revenue (see Note 3). For all funds, result-based charges, transaction costs etc. have reduced the return shown in Note 3 (see chapter 5 Costs of Administration and Capital Management).
Owing to phase-in provisions applicable until 2020, only a portion of administrative costs (98 percent in 2020, see Note 11) is charged to the pension balances of the insured. Each fund finances its costs of administration by drawing on its own fund.
| 2019 | 2020 | ||
|---|---|---|---|
| Change in contribution revenue | Contribution revenue 2020 | 295,499 | |
| Contribution revenue 2019 | 289,386 | -289,386 | |
| Contribution revenue 2018 | -278,217 | ||
| Total Change in contribution revenue | 11,169 | 6,113 | |
|
(Turnover duration 2020 + Turnover duration 2019)/2 |
x 29.93450 | ||
|
(Turnover duration 2019 + Turnover duration 2018)/2 |
x 29.70323 | ||
| Value of change in contribution revenue | 331,755 | 182,990 | |
- Duration in years, x denotes multiplication.
Contribution revenue increased by SEK 6 billion and the value of the change in contribution income amounts to almost SEK 183 billion. Below the value of the reduced turnover duration is given.
| 2019 | 2020 | ||
|---|---|---|---|
| Change in turnover duration | Turnover duration 2020 | 30.09487 | |
| Turnover duration 2019 | 29.77413 | -29.77413 | |
| Turnover duration 2018 | -29.63233 | ||
| Total Change in turnover duration | 0.14180 | 0.32074 | |
|
(Contribution revenue 2020 + contribution revenue 2019)/2 |
x 292,443 | ||
|
(Contribution revenue 2019 + contribution revenue 2018)/2 |
x 283,802 | ||
| Value of change in turnover duration | 40,243 | 93,798 | |
- Duration in years, x denotes multiplication.
| 2016 | 2017 | 2018 | 2019 | 2020 | ||
|---|---|---|---|---|---|---|
| Turnover duration | Income age | 45.66774 | 45.90862 | 45.76243 | 45.68355 | |
| Payment age | 75.52498 | 75.54095 | 75.53656 | 75.77842 | ||
| Turnover duration | 29.85724 | 29.63233 | 29.77413 | 30.09487 | ||
|
Turnover duration for contribution asset calculation |
30.13850 | 29.85724 | 29.63233 | 29.77413 | 30.09487 | |
Turnover duration is calculated as the difference between the expected payment age and income age, for more details see Appendix B – Mathematical Description of the Balance Ratio. Since income age cannot be calculated until all pension credit have been determined, the latest year for which turnover duration can be calculated is the year before the accounting year.
The bottom line of table 8.8, “Turnover duration for contribution asset calculation”, shows which turnover duration has been used for each financial year. Note, however, that the calculated balance ratio refers to the reporting year + 2 years, namely the turnover duration 30.09487 for the year 2020 is used for the calculation of the balance ratio for the year 2022.Appendix B Mathematical description of the balance ratio – describes how turnover duration is calculated.
New pension credit includes certain other adjustment amounts that affect the size of the pension liability. What these amounts consist of is shown in the following table.
| 2019 | 2020 | ||
|---|---|---|---|
| Estimated inkomstpension credit earned | 289,386 | 295,499 | |
| Adjustment amount, inkomstpension | Confirmed inkomstpension credit earned in t-1 | 277,960 | 287,823 |
| Estimated inkomstpension credit earned in t-1 | -278,217 | -289,386 | |
| Adjustments affecting pension balances, etc. | -3,801 | -3,805 | |
| Change in amounts disbursed | 10,702 | 11,559 | |
| Total Adjustment amount, inkomstpension | 6,644 | 6,191 | |
| Adjustment amount, ATP |
Effect of difference between assumed value for year t and estimate for t-1 etc. |
-81 | -196 |
| Change in amounts disbursed | 6,546 | 2,900 | |
| Total Adjustment amount, ATP | 6,465 | 2,704 | |
| Total | 302,495 | 304,394 | |
- The table is reported after the income year
Since the tax assessment for the year of the financial statements had not been completed when the statements were prepared, the value of pension credit earned during this year can only be estimated. The adjustments affecting the size of pension balances also represent tax-assessment changes etc.; see Table 8.21 A in Note 14. The change in disbursed amounts refers to changes in the pension liability to retirees as a consequence of other changes in disbursements than those due to indexation; see Table 8.21 C in Note 14.
| Active | Retired | Total | |
|---|---|---|---|
| Indexation of Pension Balance and Pensionsa | 127,674 | 127,410 | 255,084 |
| Change in Indexation regarding Pension Liabilityb | 84,651 | 0 | 84,651 |
| Total | 212,325 | 127,410 | 339,735 |
- see Table 8.12 A
- see Table 8.12.C
| Active | Retired | Total | |
|---|---|---|---|
| Indexation of Pension Balance and Pensionsa | 212,785 | 100,347 | 313,132 |
| Change in Indexation regarding Pension Liabilityb | -44,277 | 0 | -44,277 |
| Total | 168,508 | 100,347 | 268,855 |
- see Table 8.12 A
- see Table 8.12.C
| Active | Retired | Total | ||
|---|---|---|---|---|
| Inkomstpension, indexation | Effect of income index | 127,361 | 77,523 | 204,884 |
| Effect of balancing | 0 | 0 | 0 | |
| Total Inkomstpension, indexation | 127,361 | 77,523 | 204,884 | |
| ATP, indexation | Effect of income index | 313 | 49,887 | 50,200 |
| Effect of balancing | 0 | 0 | 0 | |
| Total ATP, indexation | 313 | 49,887 | 50,200 | |
| Total | 127,674 | 127,410 | 255,084 | |
| Active | Retired | Total | ||
|---|---|---|---|---|
| Inkomstpension, indexation | Effect of income index | 212,201 | 57,049 | 269,250 |
| Effect of balancing | 0 | 0 | 0 | |
| Total Inkomstpension, indexation | 212,201 | 57,049 | 269,250 | |
| ATP, indexation | Effect of income index | 584 | 43,298 | 43,882 |
| Effect of balancing | 0 | 0 | 0 | |
| Total ATP, indexation | 584 | 43,298 | 43,882 | |
| Total | 212,785 | 100,347 | 313,132 | |
Pension liability changes with the change in the income index when balancing is de-activated in the system. Balancing was activated 2010–2017 and pension liability then changed with the balance index. Since 2018, liability changes with the income index. The value of the indexation is based on projected pension liability in 2020.
| Active | Retired | Total | |
|---|---|---|---|
| Last year’s liability adjustment | 210,488 | 0 | 210,488 |
| This year’s liability adjustment | -125,837 | 0 | -125,837 |
| Total | 84,651 | 0 | 84,651 |
| Active | Retired | Total | |
|---|---|---|---|
| Last year’s liability adjustment | 166,211 | 0 | 166,211 |
| This year’s liability adjustment | -210,488 | 0 | -210,488 |
| Total | -44,277 | 0 | -44,277 |
| Active | Retired | Total | |
|---|---|---|---|
| Inkomstpension | 6,430 | 6,430 | |
| ATP | 25 | 4,048 | 4,073 |
| Total | 25 | 10,478 | 10,503 |
| Active | Retired | Total | |
|---|---|---|---|
| Inkomstpension | 17,416 | 17,416 | |
| ATP | 105 | 14,038 | 14,143 |
| Total | 105 | 31,454 | 31,559 |
The lifespan referred to here is the number of years that an average pension amount is assumed to be paid out, the so-called economic lifespan or economic annuity divisor. The method of calculating economic annuity divisors is shown in Formula B.7.5 in Appendix B.
Inkomstpension liability for pensioners is not affected by changes by lifespan changes.The average economic lifespan has increased, which contributes to a higher pension liability for pensioners by just over SEK 10 billion. Economic life expectancy has increased despite the coronavirus pandemic because a three-year average is used, and economic mortality was higher in 2017 than in 2020. The value of the change in life expectancy is the difference between the pension liability calculated with the economic annuity divisors used in the year of the financial statements, and the pension liability calculated with the economic annuity divisors used in the previous year.
| 2019 | 2020 | ||
|---|---|---|---|
| Inheritance gains arising | 61 years or older | 5,748 | 5,436 |
| 59 years or youngerb | 6,885 | 6,699 | |
| Total Inheritance gains arising | 12,633 | 12,135 | |
| Inheritance gains distributed | 61 years or older | 8,851 | 7,947 |
| 59 years or younger | 6,846 | 6,651 | |
|
Total Inheritance gains distributed |
15,697 | 14,598 | |
- Changes to the age limits for the allocation of inheritance gains mean that the years are not fully comparable.
- Died last year, distributed current year.
In connection with the increase in the minimum retirement age, the age limit for the allocation of inheritance gains was also changed as of 2020. Pursuant to the rule change, the method for accounting amounts arising was reviewed and the method for deriving accrued inheritance gains was changed. The new method provides better coverage and therefore slightly higher amounts than previously. The increase in the age limit and the change in method make the years not fully comparable.
The pension balances of deceased persons (inheritance gains arising) are distributed to the survivors of the same age. The distribution is made as a percentage increase in pension balances according to an inheritance gain factor.
The allocation is made according to two principles, the first of which relates to the younger group, and the second to the older group. Because the minimum age to be granted pension was raised from 61 to 62 as of 2020, the age limits for allocation have been adjusted.
Under the new rules, capital following death at age 60 or under will be allocated the following year (previously this limit was 59). In the year of allocation, those born in the same year as the deceased are one year older. Inheritance gains factors are determined based on pension capital for the deceased in relation to the pension capital of same-age survivors.
As of the year an age group turns 61, the estimated rather than the actual inheritance gains arising are distributed. The inheritance gains factors are calculated based on mortality observed by Statistics Sweden for a previous period. The estimated inheritance gains of those who died in the 61st year of life or later are distributed in the same year.
Allocation according to these two principles means that each year group in a year will be allocated inheritance benefits under both principles because the first principle assigns with delay. For 2020, however, this does not occur, as those born in 1959 have already been allocated according to both principles in 2019.
| 2019 | 2020 | |
|---|---|---|
| Deduction for Costs of Administration | 1,673 | 1,818 |
Costs of administration are financed by a percentage deduction from the pension balances of the insured. In order to avoid charging a disproportionately high cost to younger birth age groups during the period when the ATP is being phased out, this administrative cost deduction is being introduced in steps. In 2020, 98 percent of administrative costs were financed by a deduction from pension balances. This deduction will increase by 2 percentage points each year and thus will not cover 100 percent of administrative costs until 2021.
The calculation of the administrative cost factor is based on budgeted costs of administration, costs of the National Pension Funds for the current year and the pension balances for the preceding year (see Appendix A). The difference between the monetary amount of the deduction made and the cost confirmed is considered in the in the calculation of the administrative cost factor for the following year. The deduction for administrative costs is made by multiplying pension balances by the administrative cost factor. The deduction in 2020 was 0.0305 percent and totalled SEK 1,818 million. The previous year, the deduction amounted to 0.0288 percent or SEK 1,673 million.
| First | Second | Third | Fourth | Sixth | Total 2020 | Total 2019 | |||
|---|---|---|---|---|---|---|---|---|---|
| Assets | Stocks and shares | Swedish stocks | 108,592 | 57,697 | 115,416 | 131,131 | 9,305 | 422,141 | 357,339 |
| Foreign stocks | 169,198 | 192,669 | 173,671 | 190,918 | 32,806 | 759,262 | 692,061 | ||
|
Total Stocks and shares |
277,790 | 250,366 | 289,087 | 322,049 | 42,111 | 1,181,403 | 1,049,400 | ||
| Bonds and other interest-bearing securities, net | Swedish bonds | 38,009 | 20,514 | 31,285 | 35,438 | 282 | 125,528 | 141,698 | |
| Foreign bonds | 64,377 | 101,758 | 94,783 | 74,887 | 0 | 335,805 | 370,679 | ||
|
Total Bonds and other interest-bearing securities |
102,386 | 122,272 | 126,068 | 110,325 | 282 | 461,333 | 512,378 | ||
| Derivatives | 7,595 | 10,203 | 9,671 | 12,628 | 1,760 | 41,857 | 21,082 | ||
| Other assets | 5,679 | 9,595 | 7,714 | 7,128 | 1,317 | 31,433 | 34,441 | ||
| Total Assets | 393,450 | 392,436 | 432,541 | 452,130 | 45,470 | 1,716,027 | 1,617,307 | ||
| Liabilities | Derivatives | -763 | -2,412 | -384 | -1,408 | -39 | -5,006 | -5,694 | |
| Others | -50 | -3,800 | -9,183 | -1,273 | -274 | -14,580 | -15,270 | ||
| Total Liabilities | -813 | -6,212 | -9,567 | -2,681 | -313 | -19,586 | -20,964 | ||
| Total | 392,637 | 386,224 | 422,974 | 449,449 | 45,157 | 1,696,441 | 1,596,342 | ||
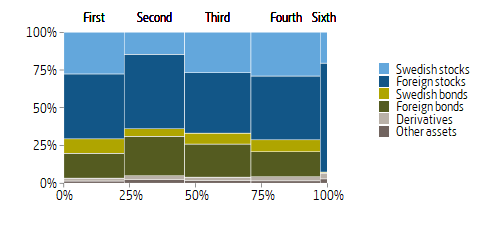
The data is taken from the annual report of each fund. The item of Other assets include cash and bank balances, prepaid expenses and accrued revenue etc. The item Other under Liabilities includes deferred income and accrued charges.
| 2019 | 2020 | |
|---|---|---|
| Contribution revenue | 289,386 | 295,499 |
| Turnover duration (years)a | x 29.77413 | x 30.09487 |
| Contribution Asset | 8,616,216 | 8,893,004 |
- x denotes multiplication
See Note 5 and Note 6 and Appendix B for the values and formulas used in calculating contribution revenue and turnover duration.
| Active | Retired | Total | |
|---|---|---|---|
| Inkomstpension | 6,252,655 | 2,338,804 | 8,591,459 |
| ATP | 8,861 | 1,308,765 | 1,317,626 |
| Indexation/balancing | -125,837 | 0 | -125,837 |
| Total | 6,135,679 | 3,647,569 | 9,783,248 |
| Active | Retired | Total | |
|---|---|---|---|
| Inkomstpension | 6,094,659 | 2,152,255 | 8,246,914 |
| ATP | 12,774 | 1,405,028 | 1,417,802 |
| Indexation/balancing | -210,488 | 0 | -210,488 |
| Total | 5,896,945 | 3,557,283 | 9,454,228 |
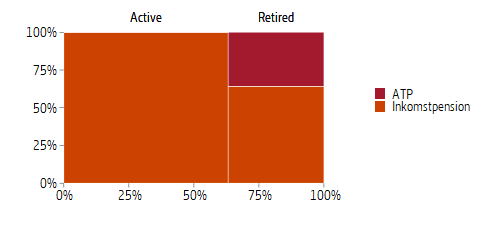
The pension liability to retirees for the ATP and the inkomstpension is calculated in the same manner for both. A cohort’s liability is obtained from the product of the cohort’s pension disbursements in December, a factor of 12 to get the annual amount, and the cohorts average economic lifespan. The total liability to retirees is the sum of the cohorts’ pension liabilities. Average economic life expectancy is expressed in the form of economic annuity divisors.
Inkomstpension liability to persons who have not started to draw old-age pension valued at the sum of all the insured’s pension reserves at the end of the year end, without taking into account the upward revision of the income index between year \(t\) and \(t+1\) (2020 and 2021). To the liability is also added an estimate of the pension credit for inkomstpension earned during the accounting year. The liability is also adjusted for the difference between the previous year’s estimated and determined pension credit.
The ATP liability for individuals (born 1938–1953) who have not yet retired is estimated as the annual pension they would have received if they had retired in December 2020. In order to calculate the liability, the pension is multiplied by the economic annuity divisor the expected remaining disbursement period for each cohort. The ATP liability to the economically active is gradually decreasing due to the phasing-out of the system, liability amounting to almost SEK 9 billion in 2020 (SEK 13 billion in 2019).
The pension liability increased by just over 3 percent or by SEK 329 billion. Many factors are involved in this increase some of the most important being increased contributions and higher indexation.
| 2019 | 2020 | |
|---|---|---|
|
Inkomstpension liability to the economically active, December 31, t-1 |
5,870,293 | 6,094,659 |
|
Of which estimated pension credit for inkomstpension earned in year t-1 |
-278,217 | -289,386 |
| Subtotal Pension balances as of December 31, t-1 | 5,592,076 | 5,805,273 |
|
Inheritance gains arising from persons dying at or before age 59a |
-6,885 | -6,699 |
| Adjustments affecting pension balancesb | -691 | -172 |
| Subtotal Opening pension balance in year t | 5,584,500 | 5,798,402 |
| Inheritance gains arising, persons dying at or after age 61 | -5,748 | -5,436 |
|
Changes in tax assessments etc. affecting pension balances |
-3,110 | -3,633 |
| Confirmed inkomstpension credit earned in year t-1c | 277,960 | 287,823 |
|
Distributed inheritance gains from persons dying at or after age 61 |
8,851 | 7,947 |
|
Distributed inheritance gains from persons dying at or before age 59d |
6,846 | 6,651 |
| Indexation | 212,201 | 127,361 |
| Deduction for administrative costs | -1,673 | -1,818 |
| Pensions drawn | -278,232 | -263,791 |
| Pensions revoked | 3,678 | 3,650 |
| Subtotal Pension balances as of December 31, t | 5,805,273 | 5,957,156 |
| Estimated inkomstpension credit earned in year t | 289,386 | 295,499 |
| Total Inkomstpension liability to the economically active | 6,094,659 | 6,252,655 |
- Distributed in year t.
- Adjustments for deceased persons, sealed cases, etc.
- See Note 7.
- Arising year t-1.
| 2019 | 2020 | |
|---|---|---|
| ATP liability to the economically active, December 31, t-1 | 19,898 | 12,774 |
|
Effect of difference between assumption for year t and estimate in t-1 etc. |
-81 | -196 |
| Opening ATP liability, year t | 19,817 | 12,578 |
| Indexation | 584 | 313 |
| Pensions drawn | -7,732 | -4,055 |
| Value of change in life expectancy | 105 | 25 |
| ATP liability to the economically active | 12,774 | 8,861 |
| Inkomstpension | ATP | Total | |
|---|---|---|---|
| Pension liability to retirees, December 31 t-1 | 2,152,255 | 1,405,028 | 3,557,283 |
| Additional liability to the economically activea | 260,141 | 4,055 | 264,196 |
| Change in amounts disbursed | 11,559 | 2,900 | 14,459 |
| Pensions disbursedb | -169,104 | -157,153 | -326,257 |
| Indexation | 77,523 | 49,887 | 127,410 |
| Value of change in life expectancy | 6,430 | 4,048 | 10,478 |
| Total | 2,338,804 | 1,308,765 | 3,647,569 |
- Inkomstpension: Net of Pensions drawn and Pensions revoked, see Table 8.21 A. ATP: See Table 8.21 B.
- See Note 2.
The liability to pensioners changes with indexation and economic longevity, and decreases with the payments made during the year. The pension may change for reasons such as new earnings, change in marital status (for ATP pensions), changes in valuation, etc. Such changes in the liability are recorded as a change in the amount paid (change in amount). The liability to retired persons also increases with new pensions granted. This increase in the liability is matched by a decrease in the pension liability to active persons.
| 2019 | 2020 | ||
|---|---|---|---|
| Pension disbursements | Fund insurance | 9,510 | 12,344 |
| Traditional insurance | 1,432 | 1,682 | |
| Total Pension disbursements | 10,942 | 14,025 | |
| Transfers to European Communities | 0 | 3 | |
| Total | 10,942 | 14,028 | |
At the time of retirement, a pension saver has the option of retaining her/his accumulated balance in fund insurance; the amount of the pension will then depend on the rate of return of the funds chosen by the saver. The other option is to switch to traditional insurance with profit annuity, either on retirement or later. With traditional insurance with profit annuity, the pension is disbursed as a nominal guaranteed monthly amount. If the management of the traditional insurance with profit annuity capital achieves a return higher than the guaranteed rate, pension savers will receive a rebate in the form of a monthly supplement, which may vary from year to year. In 2020, SEK 988 million was disbursed in supplementary amounts, as shown in Note 23. In 2019 the supplementary amount was SEK 774 million.
According to the Act (2002:125) on Transfer of Pension Credit to and from the European Communities (EC), the value of pension credit for EC officials can be transferred from the National Pension Funds and the premium pension system to the service pension system of the EC. In 2020, transfers of SEK 3 million were made from the premium pension.
| Fund Insurance | Traditional insurance | Total 2020 | Total 2019 | |||
|---|---|---|---|---|---|---|
| Return | Stocks and shares | Direct return | 22 | 62 | 84 | 85 |
|
Realized and unrealized capital gains |
96,306 | 865 | 97,171 | 327,912 | ||
| Total Stocks and shares | 96,328 | 927 | 97,255 | 327,996 | ||
| Bonds and other interest-bearing securities | Direct return (net interest) | 0 | -4 | -4 | -13 | |
|
Realized and unrealized capital gains |
727 | 1,379 | 2,106 | 2,198 | ||
|
Total Bonds and other interest-bearing securities |
727 | 1,375 | 2,102 | 2,185 | ||
| Net foreign-exchange gain/-loss | -4,978 | 0 | -4,978 | 1,311 | ||
| Total Return | 92,077 | 2,302 | 94,379 | 331,491 | ||
| Allocated Management Fees | 4,622 | 21 | 4,643 | 4,741 | ||
| Change, Traditional insurance | 2,765 | 2,765 | 5,679 | |||
| Total | 96,699 | 2,323 | 101,787 | 341,911 | ||
The return earned includes realized and unrealized foreign-exchange gains and losses after deduction of fund management costs and distributed rebates of fund management fees.
The pension liability was changed by the return on the premium pension funds, which totals SEK 94,379 (SEK 331,491 in 2019) million.
| 2019 | 2020 | |
|---|---|---|
| Operating expenses | 554 | 510 |
| Financial items, net | 43 | -66 |
| Total | 597 | 444 |
The item of Financial items, net, refers primarily to borrowing expenses, gain/-loss on trade inventories (see Note 22) and interest revenue (net). Costs of fund management are paid directly from insurance assets and are not included in the premium pension system’s operating expenses. Total costs of administration in 2020 were SEK 444 million, of which SEK 21.4 million refers to change in traditional insurance with profit annuity. The corresponding amount for costs of administration in 2019 was SEK 597 million, of which SEK 20.8 million refer to traditional insurance with profit annuity. A presentation of the respective gross and net reported costs is provided in the chapter Costs of Administration and Capital Management.
| 2019 | 2020 | ||
|---|---|---|---|
|
Preliminary contribution revenue, including interest on the premium pension earned in 2017/2018 |
47,440 | 48,670 | |
| Adjustment amount, confirmed pension credit |
Confirmed pension credit, including interest, for the premium pension earned in 2018/19 and 2019/20 |
42,986 | 44,487 |
|
Preliminary contribution for the premium pension earned in 2018/19 and 2019/20 |
-45,298 | -47,440 | |
| Total Adjustment amount, confirmed pension credit | -2,312 | -2,953 | |
| Change in pension credit | 12 | 10 | |
| Total | 45,140 | 45,727 | |
In the operations of the premium pension system, the equivalent of contribution revenue is new pension credit including interest for the period during which the contribution moneys are managed before being invested in the funds chosen by the insured. During the year, changes in pension credit have come from previous income years. Total new pension credit for the premium pension in 2020 was SEK 45,727 million; in 2019 it was SEK 45,140 million.
| 2019 | 2020 | |
|---|---|---|
| Inheritance gains arising | 3,700 | 4,135 |
| Inheritance gains distributed | 3,700 | 4,135 |
Inheritance gains arising and distributed are analogous to decedents’ capital. Inheritance gains are distributed once a year; in addition, a minor portion is distributed during the course of the year in connection with changeovers from fund insurance to traditional insurance with profit annuity. In 2020 inheritance gains distributed were SEK 4,135 million; this amount was determined by the sum of the capital released by deaths in calendar year 2019. The corresponding amount distributed in 2019 was SEK 3,700 million. This item includes reductions in premium pension credit when premium pensions are transferred between spouses.
| 2019 | 2020 | |
|---|---|---|
| Deduction for costs of administration | 474 | 508 |
The amount of SEK 508 million is for the fees deducted by the Swedish Pensions Agency to finance the costs of administration for the premium pension system in 2020. The average fee for 2020 was equivalent to 0.04 percent of pension savers’ account balances with a ceiling of SEK 100.
| Fund insurance | Traditional insurance | Temporary management | Total 2020 | Total 2019 | |
|---|---|---|---|---|---|
| Stocks and shares | 1,484,062 | 18,713 | 1,502,775 | 1,388,529 | |
|
Bonds and other interest-bearing securities |
94,607 | 34,335 | 41,568 | 170,510 | 156,731 |
|
Trade in progress and inheritance gains arising |
4,352 | 332 | 4,684 | 3,788 | |
| Total | 1,583,021 | 53,380 | 41,568 | 1,677,969 | 1,549,049 |
In 2020, insurance assets in fund insurance amounted to SEK 1,583,021 million, of which SEK 4,352 million was attributable to current trading and mortality capital. Temporary management of preliminary contributions refers to income year 2020. As of December 31, 2020, there were 6,168,986 premium pension savers, all of them in fund insurance, and 1,723,114 pensioners, of whom 1,381,612 were in fund insurance and 341,502 in traditional insurance with profit annuity.
| 2019 | 2020 | |
|---|---|---|
|
The Swedish Pensions Agency’s administrative inventory of fund shares (trading inventory) |
87 | 132 |
| Other assets | 7,261 | 10,961 |
| Total | 7,348 | 11,093 |
The Swedish Pensions Agency’s administrative inventory of fund shares facilitates trade in fund shares by reducing the number of trading transactions with fund managers.
The item of Other assets consist of cash and bank balances, fund trading in progress, other receivables and accrued interest revenue.
| Fund insurance | Traditional insurance | Total 2020 | Total 2019 | |
|---|---|---|---|---|
|
Opening owner equity: Consolidation fund |
-121 | 16,883 | 16,762 | 11,982 |
|
Rebate paid from consolidation fund |
-988 | -988 | -774 | |
| Net income for the period | 65 | 2,765 | 2,830 | 5,554 |
| Total owner equity | -56 | 18,660 | 18,604 | 16,762 |
At the beginning of the year, the Swedish Pensions Agency reported negative equity for unit-linked insurance operations. The solvency rules of the Insurance Business Act do not apply to the Swedish Pensions Agency, but the deficit is financed by credit at the National Debt-Office. In 2020 a balance between assets and liabilities was reached. Traditional insurance with profit annuity reports a positive result that will be added to the consolidation fund as owner equity. The amounts in the consolidation fund are distributed to pensioners as refunds in connection with pension disbursements.
| 2019 | 2020 | |
|---|---|---|
| Fund insurance | 1,461,885 | 1,583,251 |
| Traditional insurance | 29,602 | 34,780 |
| Liabilities in regard to preliminary contributions | 40,674 | 41,568 |
| Total | 1,532,161 | 1,659,599 |
The pension liability is a liability to pension savers and to pensioners. Pension liability in fund insurance is linked primarily to fund shares and is affected by the development of the market value of the funds chosen.
Pension liability in traditional insurance with profit annuity is calculated for each insurance as the capital value of remaining guaranteed disbursements. The value is calculated on assumptions about future return, life expectancy and operating expenses. The value of the asset is shown in Note 21.
Information on how the economic annuity divisors for fund insurance and traditional insurance with profit annuity are calculated is found in Appendix A Calculation Factors.
Liabilities in regard to preliminary contributions correspond to the assets invested under temporary management; the value of these assets can be found in Note 21.
| Fund insurance | Traditional insurance | Liabilities in regard to preliminary contributions | ||
|---|---|---|---|---|
| Premium pension capital, December 31, 2020 | Pension liability, December 31, 2019 | 1,461,885 | 29,602 | 40,674 |
| Change in value | 92,076 | 2,301 | ||
|
Confirmed premium pension credit earned in 2019 |
44,098 | 389 | -44,487 | |
|
Preliminary contributions, premium pension, earned in 2020 |
48,670 | |||
| Management fees allocated, etc. | 4,622 | 21 | ||
| Inheritance gains arising | 3,806 | 328 | ||
|
Settlement, preliminary contributions, previous years |
-44 | |||
|
Change in pension credit for the premium pension |
10 | 0 | ||
|
Decrease in liability because of pensions drawn in 2020 |
-12,344 | -1,682 | ||
|
Switch to Traditional insurance from fund insurance |
-6,926 | 6,926 | ||
| Inheritance gains distributeda | -3,806 | -328 | ||
| Deduction for costs of administration | -508 | |||
| Change in pension liability | -2,765 | |||
| Other | 338 | -13 | -3,245 | |
|
Total Premium pension capital, December 31, 2020 |
1,583,251 | 34,779 | 41,568 | |
|
Adjustment affecting premium pension capital |
||||
| Total | 1,583,251 | 34,779 | 41,568 | |
- Inheritance gains, capital released in 2019, to be allocated in 2020.
The pension liability is changed by new pension credit earned, preliminary contributions, changes in the extent of pension withdrawal, changes in pension credit due to changes in taxation, changes in value of assets, costs of administration, pension disbursements and estimates of future mortality for the insured.
| 2019 | 2020 | |
|---|---|---|
| Other liabilities | 7,469 | 10,854 |
|
Share of consolidated Swedish Pensions Agency assets, liabilities and result, net |
5 | 5 |
| Total | 7,474 | 10,859 |
Other liabilities consist chiefly of fund trading in progress, borrowings from the National Debt Office, accrued management fees and accrued interest fees.
The accounting for the premium pension’s share of the Swedish Pensions Agency’s assets, liabilities and results has been simplified so that a net amount is reported. It is included so that the balance sheet will balance.